Dec
6th
Stay connected Subscribe to our RSS feed
In the early days of motorsport, aerodynamic studies were performed by sticking wool tufts on the race cars to show surface aerodynamic flows at speed. Nowadays, a special paint is applied on certain components of the car to visualise the flow of air.
Aerodynamicists are fully aware that work in wind tunnel and CFD programs can provide great virtual results, but it is safer to double check the behaviour of air at speed on the race track.
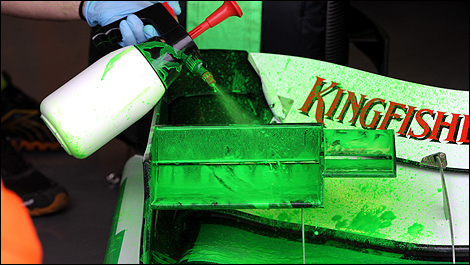
Flow visualisation paint -- better known as “flow viz” -- is a fluorescent powder suspended in a light oil, often paraffin. This paint is liberally applied by a spray gun to bodywork up-stream of the area engineers want to investigate.
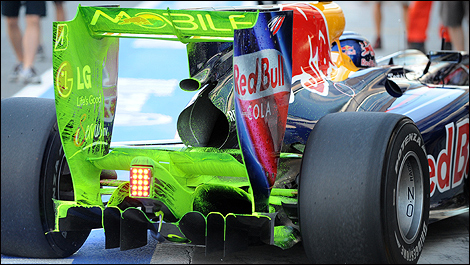
Before the paint has a chance to dry, the car runs at high speed around the circuit. As it does so, the air flow across the car moves the paint around, where it subsequently dries and shows detailed air flow patterns across the car.
Comparison of the relative movements of the dye particles provides an indication of the relative strengths of the air flow acting on the surfaces of the component under test. Intense stripes of coloured paint indicate the zones in which the velocity is higher.
 |
| Photo: WRi2 |
Aerodynamicists are fully aware that work in wind tunnel and CFD programs can provide great virtual results, but it is safer to double check the behaviour of air at speed on the race track.
Flow visualisation paint -- better known as “flow viz” -- is a fluorescent powder suspended in a light oil, often paraffin. This paint is liberally applied by a spray gun to bodywork up-stream of the area engineers want to investigate.
 |
| Photo: WRi2 |
Before the paint has a chance to dry, the car runs at high speed around the circuit. As it does so, the air flow across the car moves the paint around, where it subsequently dries and shows detailed air flow patterns across the car.
Comparison of the relative movements of the dye particles provides an indication of the relative strengths of the air flow acting on the surfaces of the component under test. Intense stripes of coloured paint indicate the zones in which the velocity is higher.
 |
| Photo: WRi2 |
 The latest auto news, reviews, prices, product and vehicle releases.